I thought the only way to combine predictive power and interpretability is by using methods that are somewhat in the middle between 'easy to understand' and 'flexible enough', like decision trees or the RuleFit algorithm or, additionally, by using techniques like partial dependency plots to understand the influence of single features. Then I read the paper "Why Should I Trust You" Explaining the Predictions of Any Classifier [1], which offers a really decent alternative for explaining decisions made by black boxes.
What is LIME?
The authors propose LIME, an algorithm for Local Interpretable Model-agnostic Explanations. LIME can explain why a black box algorithm assigned a specific classification/prediction to one datapoint (image/text/tabular data) by approximating the black box algorithm locally with an interpretable model.
Why was the husky classified as a wolf?
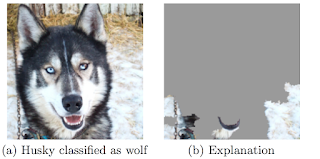
The trustworthiness of an image classifier trained on the task 'Husky vs Wolf' is analysed, as an example in the paper [1]. As a practitioner, you want to check individual false classifications and understand why the classifier went wrong. You can use LIME to approximate and visualize why a husky was classified as a wolf. It turns out that the snow in the image was used to classify the image as 'wolf'. In this case it could help to add more huskies with snow in the background to your training set and more wolfs without snow. |
| Figure from LIME paper [1]: The husky was mistakenly classified as wolf, because the classifier learned to use snow as feature. |
How LIME works
First you train your algorithm on your classification/prediction task, just as you would usually do. It does not matter if you use a deep neural network or boosted trees, LIME is model-agnostic.With LIME you can then start to explore explanations for single data points. It works for images, texts and tabular input. LIME creates variations of the data point that you want to have explained. In the case of images, it first splits your image into superpixels and creates new images by randomly switching on and off some of the superpixels. For text it creates versions of the text with some of the words removed. For tabular data the features of the data point are perturbed, to get variations of the data point that are close to the original one. Note that even if you have trained your classifier on a different representation of your data, like bag-of-ngrams or transformations of your original image, you still use LIME on the original data. By creating new variations of your input you create a new dataset (let's call it local interpretable features), where each row represents a perturbation of your input and each column the (interpretable) features (like superpixel). The entries in this datasets are 1 if the superpixel/word was turned on and 0 if it was turned off in a sample. For tabular data the entries are the perturbed values of the features.
LIME puts all those variations through the black box algorithm and gets the predictions. Now the corresponding local interpretable features (e.g. superpixels switched on/off) are used to predict the corresponding output of the black box algorithm. A good choice of model for this job is LASSO, because it will yield a sparse model (e.g. only a few superpixel might be important for the classification). LIME chooses the K best features which then are returned as explanation. For images, each local interpretable feature represents a superpixel and K features are a combination of the best superpixels. For text, each local interpretable feature represents a word and K features are the most important words for the prediction of the black box. In case of tabular data, K features are the columns that contributed most to the prediction.
Why does it work?
The decision boundaries of machine learning algorithms (like neural networks, forests and SVMs) are usually very complex and cannot be comprehended. This changes when you zoom in to one example of your data. The local decision function might be very simple and you can try to approximate it with an interpretable model, like a linear model (LASSO) or a decision tree. Your local classifier has to be faithful, meaning it should reflect the outcome of the black box algorithm closely, otherwise you will not get correct explanations. |
| Figure from LIME paper [1]: Toy example for decision boundaries of a classifier. Blue/red represent different classes. The points are perturbed examples.The line shows the local decision boundary learned by LIME for the highlighted data point. |
Why is this important?
As machine learning is used in more and more products and processes, it is crucial to have a way of analysing the decision making processes of the algorithms and also to build up trust with the interacting humans.I predict we will see a future with a lot more machine learning algorithms integrated in every aspect of our life and, coming with that, also regulation and assessments for algorithms, especially in the health, legal and financial industries
What next?
Read the paper: https://arxiv.org/abs/1602.04938Try out the LIME with Python (only works for text and tabular data at the moment): https://github.com/marcotcr/lime
I have a prototype for the images here: https://github.com/christophM/explain-ml
[1] Ribeiro, M et. al, 2016, "Why Should I Trust You" Explaining the Predictions of Any Classifier. https://arxiv.org/abs/1602.04938